What Insights Do The Assignment View Reports Provide?
The Assignment View provides teachers with an easy-to-navigate, quick look at class and student performance on any individual assignment. Teachers can analyze how their class and individual students performed on any gradable task.
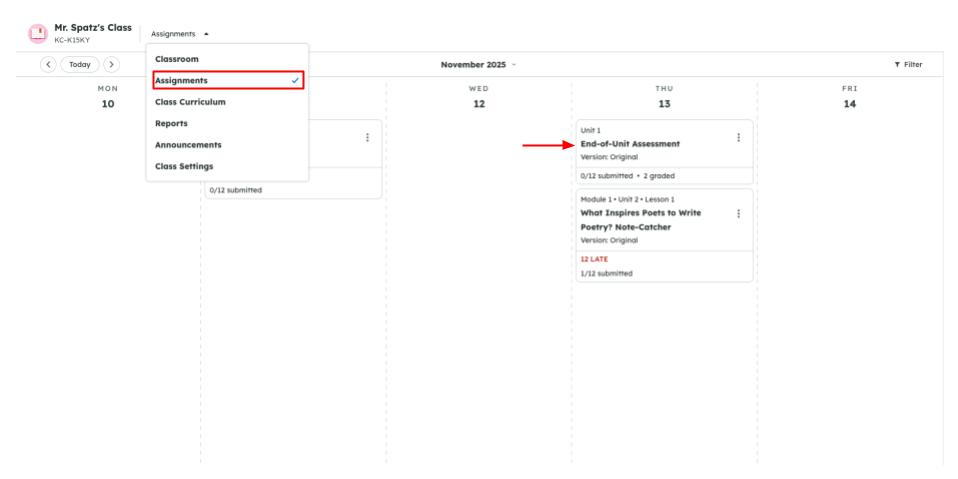
What happens after I assign an activity?
Once content is assigned, navigate to the Assignment page. Here you will find boxes for each of your assigned activities on their due dates with details, including the name of the assignment, which version of the assignment, and how many students have submitted the assignment. Clicking on an assignment opens the Assignment View.
The Assignment View includes a Scoreboard and Scorecard which display a classroom-level summary and an overview of individual student performance on an assignment. It also includes two student-level reports: a question-focused report and a standard-focused report.
Scoreboard

The Scoreboard provides the most important classroom-level information to teachers. The Scoreboard highlights:
- Assignment Settings: Type of assignment, total points, total questions/standards, due date
- Assignment Status: Shows how many students have submitted the assignment, viewed the assignment but haven’t submitted yet, or haven’t accessed the assignment
- Grade Average: Overall success rate of the entire class for the given assignment
- Grade Distribution: Range of grades received by students on the assignment
You can also hover over each bar to see which students fell into each mastery category, making it easier to provide immediate feedback and support. Please note that the grade average and the grade distribution data will be displayed after grading all submitted assignments.
Scorecard

The Scorecard provides a deeper look into how each student performed on the assignment at the question level and at the standard level.
To learn more about how to grade assignments, click here.
Question View
In Question View, the data is sorted by individual questions. You will see a breakdown of how each student performed on each question and can see the class’s overall success rate on a given question. Auto-graded questions will already have scores displayed, while teacher-graded questions will not display a score until they have been manually graded. Auto-graded questions will have our robot icon next to the question. You can hover over each question to learn more about the question, including the point value, question text, type of question, and the standards associated with the question.

The Question View can be filtered to quickly see which questions assessed a particular standard and to get a quick overview of how students performed on those questions. To filter questions by standard, click the “Standards” filter button in the top right corner of the Scoreboard. A drop-down menu of the assignment’s standards will appear for you to select and filter.

Standards View
In Standards View, the data is sorted based on standards performance. You will see an individual student breakdown on each standard that was assessed in the assignment, as well as the class’s overall performance on a given standard. You can hover over each standard for a preview of the full standard along with the related questions.
Please note that standards need to be aligned at the question level within an assignment in order to appear in Standards View. If a standard is only aligned to the entire assignment and not to specific questions, it will not be displayed in the report. To learn more about how to align questions to specific standards, click here.

To switch between Question View and Standards View, click on the slider above the data.

Can I download/print the Assignment Report?
Yes! To download the report, click on the downward-facing arrow in the upper right corner. This will download the data in CSV format. The downloaded spreadsheet can then be printed.
